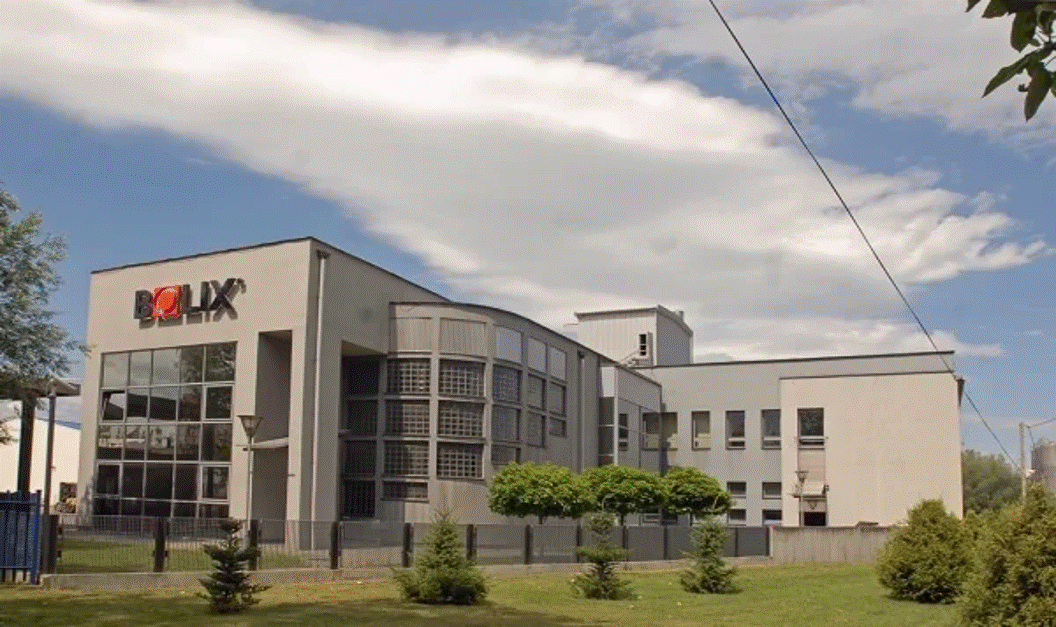
Bolix is a Polish manufacturer of building chemicals specializing in the production of cladding systems. Ever-growing interest in the company’s products had triggered a need for parallel growth in the areas of advanced analytics and up-to-date knowledge of the business’s data.
The goals set for the Novacura team were clear — the roll-out was to be brief in duration while also minimizing the amount of financial and IT resources involved. The time being spent by Bolix IT department members was actually one of the driving issues behind the change.
We wanted to get a single flexible tool to analyse the various processes at play in the company, and at the same time simplify the process of reporting regional sales figures as well as shorten data transfer times between systems (...)
The way reports had been generated until then — on the basis of IFS data views, i.e. Crystal Reports and Excel — was occupying too many people. The new tools were to enable the creation of intuitive analyses and dashboards, as well as facilitate data exploration, thanks to which managers would be able to deepen their understanding of the business and meet customers’ expectations even better than before.
Data demystified
Knowing exactly what Bolix needed, Novacura’s implementation team were able to take action immediately and precisely. The specialists focused on constructing an analytical model for sales and margin performance data. They prepared mechanisms for feeding in and transposing data — from basic lexical entries to complex, analytical data.
Being able to easily navigate large data sets that come from various sources, as well as being able to ask questions in an intuitive way, frees up analytical possibilities. It also allows hidden connections to be discovered and new knowledge to be gleaned and, potentially, put to excellent use (...)
On the basis of the model they constructed, the team also identified a layer of ‘metadata’ (dimensions, measurements, and visualizations). All of this was done so that users of the new system can focus on their primary concern: analysing the information collected and drawing conclusions from it.

Analyses, comparisons, indicators
After three days of advanced work at the client’s place of business, Novacura presented Bolix staff with a fully functional solution enabling them to carry out broad-ranging analyses that cover the entire history of the company. Novacura’s experts had designed a sales application that included indicators for individual business lines and product groups, along with analyses divided by region and sales representative. They had also initiated GM1 margin performance analysis and furnished the option of comparing the best- and worst-selling products, as well as income margin performance according to individual sales reps and their clients.
What we particularly liked was being able to bring together data from different sources and then draw conclusions on that basis. We utilized this ability above all by creating a large number of analyses pertaining to sales and management control. Today we have a clearer picture of the interdependence of different variables and we can react more quickly to problems, which translates into greater efficiency from our teams.
Moreover, management staff at Bolix could now view — directly on their screens — the most important enterprise indicators, such as current revenue, cumulative margin, seasonal sales trends, a complexity breakdown according to business line and product group, and a list of the top 25 clients.
Faster reaction time, less downtime
Bolix immediately noticed the gains from implementing the Qlik tool. The fast and comprehensive analyses allowed managers to discover new trends and connections among the data at their fingertips.
Over the course of a few days, Novacura was able to share its expertise with Bolix employees showing them where data of strategic importance to the company are located, and to offer suggestions as to how they might be extracted and analysed in a way that would benefit and streamline the business.


